Portfolio Analysis
Data Extraction & Visualization (Fall 2024)
This project presents a comprehensive portfolio analysis tool combining SQL-based data extraction with Tableau visualization capabilities. The system analyzes financial portfolio data for an individual client, providing insights into investment performance, risk assessment, and potential portfolio optimization opportunities.
Features
- DuckDB integration for efficient data processing
- Sequential query execution for streamlined analysis
- Responsive full-width layout design
- Interactive data visualization
- Export functionality in CSV and Parquet formats
- Automated data processing and handling
- Real-time data extraction capabilities
Part 1: Data Extraction (SQL)
The SQL component integrates multiple data sources including account dimensions, customer details, holdings, and pricing information. It processes this data through a series of analytical queries:
- SQL View: Creates a comprehensive view consolidating all client portfolio data with relevant dimensions and metrics
- Query 1: Analyzes portfolio performance through 12, 24, and 36-month return calculations for individual securities and the overall portfolio
- Query 2: Evaluates investment risk through sigma (volatility) calculations and average daily returns
- Query 3: Identifies potential investment opportunities by analyzing securities not currently in the portfolio
- Query 4: Calculates risk-adjusted returns (Sharpe-like ratio) to determine optimal investment efficiency
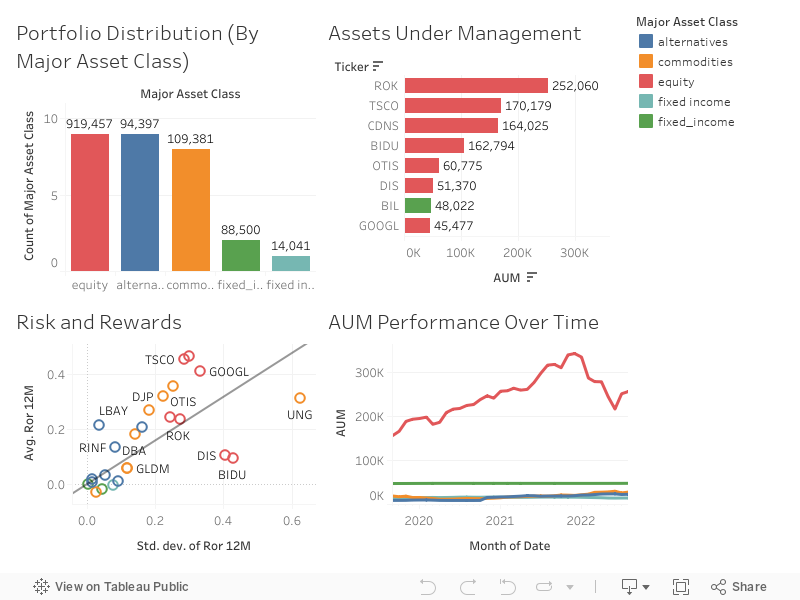
Part 2: Interactive Dashboard (Tableau)
The Tableau dashboard provides an interactive visualization layer that transforms the SQL analysis into actionable insights:
- Asset allocation breakdown and portfolio composition
- Historical performance trends and comparisons
- Risk-return relationship visualization
- Dynamic filtering and drill-down capabilities
- Fullscreen viewing mode for detailed analysis
- Real-time metric updates and portfolio monitoring
This dual-approach methodology combines the computational power of SQL with the visual analytics of Tableau, providing a robust platform for comprehensive portfolio analysis and decision-making support.
Interactive Dashboard (Tableau)
Data Extraction (SQL)
SQL View: Customer Portfolio
-
Step 1: Identify your client (listed above) in your database - learn about your client and what they have. Create all required relationships between tables (joins) to better understand what assets your client has, asset classifications, asset types and prices.
-
Step 2: Once you get that large joined table with all your client's assets and their prices (from Step1) - use that data to create a VIEW in the invest schema with data for your client. This view should have the following information: asset classification (major and minor), asset names, asset types, prices with pricing information and dates and have ONLY the data related to your client. Make sure to add all necessary filters for your VIEW.